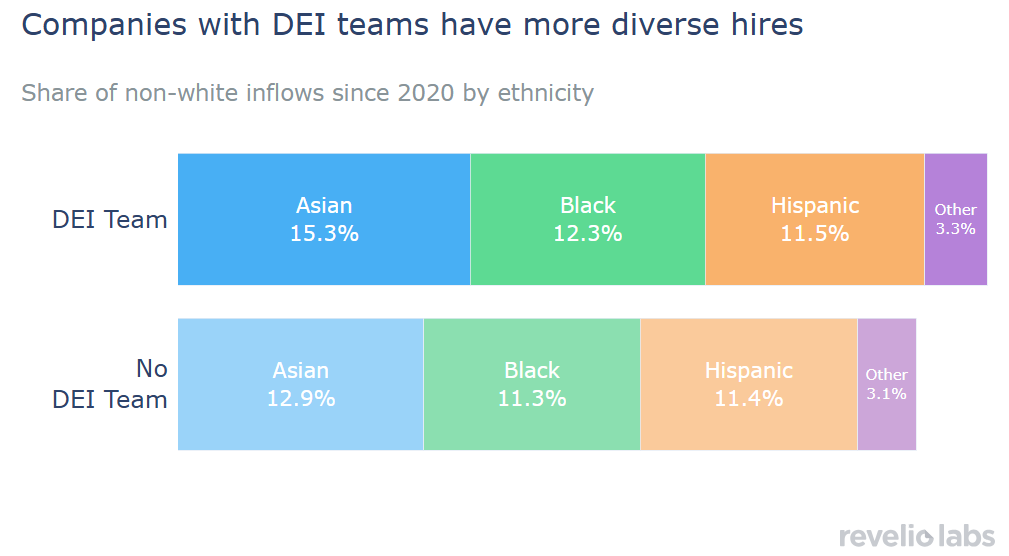
Stacked bar chart comparing the share of non-white hires since 2020 at companies with and without DEI teams, broken down by ethnicity. Companies with DEI teams hired 15.3% Asian, 12.3% Black, 11.5% Hispanic, and 3.3% other non-white employees, compared to 12.9% Asian, 11.3% Black, 11.4% Hispanic, and 3.1% other at companies without DEI teams.
Were diversity efforts genuine, or just optics?
Figure 2.Stacked bar chart comparing the share of non-white hires since 2020 at companies with and without DEI teams, broken down by ethnicity. Companies with DEI teams hired 15.3% Asian, 12.3% Black, 11.5% Hispanic, and 3.3% other non-white employees, compared to 12.9% Asian, 11.3% Black, 11.4% Hispanic, and 3.1% other at companies without DEI teams. Source: Revelio Labs, September 2025
title="Stacked bar chart comparing the share of non-white hires since 2020 at companies with and without DEI teams, broken down by ethnicity. Companies with DEI teams hired 15.3% Asian, 12.3% Black, 11.5% Hispanic, and 3.3% other non-white employees, compared to 12.9% Asian, 11.3% Black, 11.4% Hispanic, and 3.1% other at companies without DEI teams."