Pie chart showing the share of career transitions from a DEI role since 2022, divided into three categories: another DEI role (7.38%), non-DEI role at a different company (55.4%), and non-DEI role at the same company (37.2%).
Were diversity efforts genuine, or just optics?
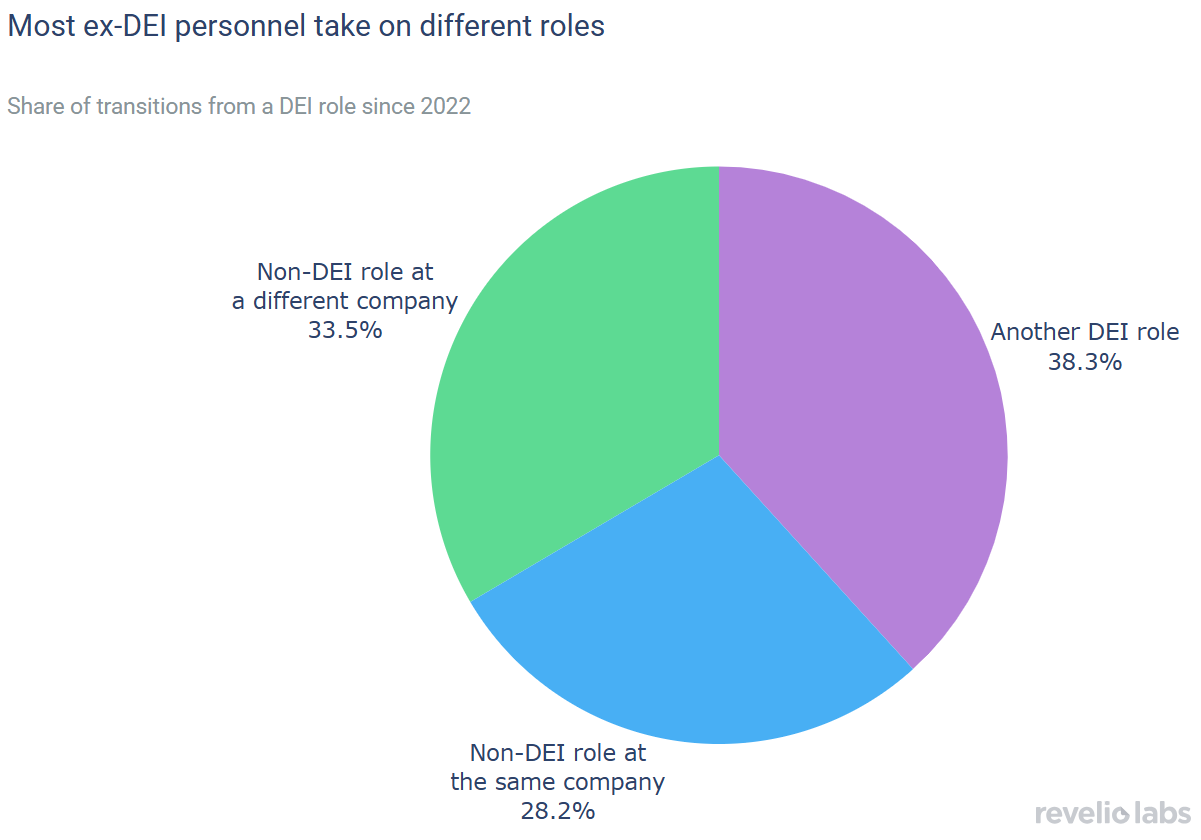
Figure 4.Pie chart showing the share of career transitions from a DEI role since 2022, divided into three categories: another DEI role (7.38%), non-DEI role at a different company (55.4%), and non-DEI role at the same company (37.2%). Source: Revelio Labs, September 2025
title="Pie chart showing the share of career transitions from a DEI role since 2022, divided into three categories: another DEI role (7.38%), non-DEI role at a different company (55.4%), and non-DEI role at the same company (37.2%)."