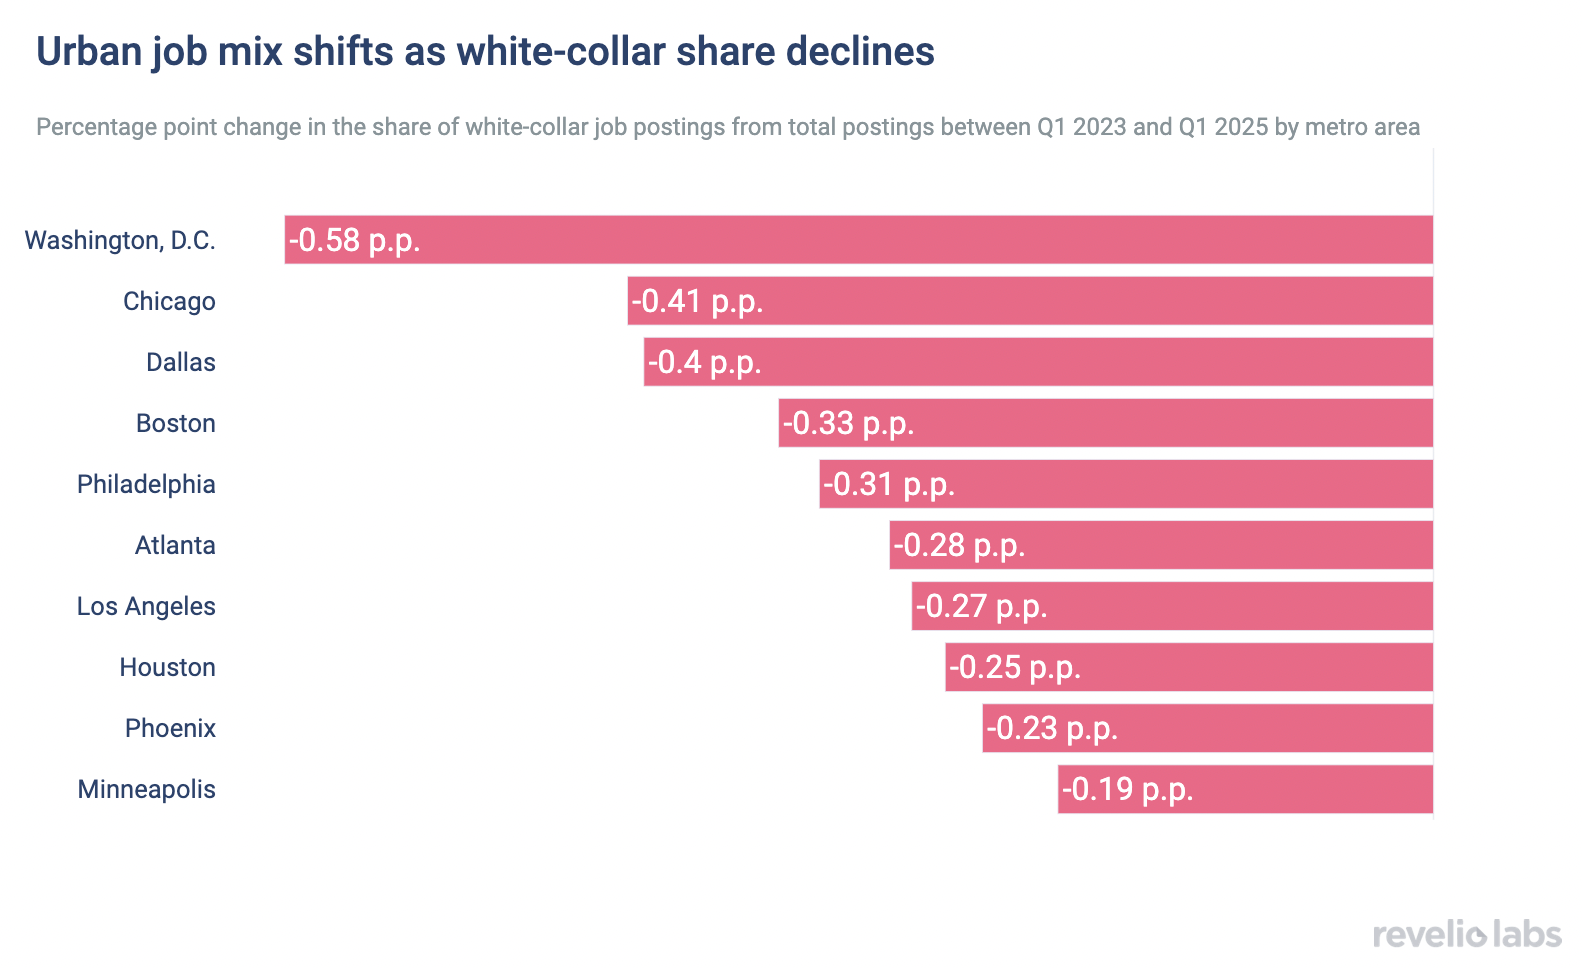
Horizontal bar chart showing the percentage point change in the share of white-collar job postings out of total postings, by metro area, between Q1 2023 and Q1 2025. Washington, D.C. saw the largest decline at -0.58 percentage points, followed by Chicago (-0.41), Dallas (-0.40), Boston (-0.33), Philadelphia (-0.31), Atlanta (-0.28), Los Angeles (-0.27), Houston (-0.25), Phoenix (-0.23), and Minneapolis (-0.19).
In a slowing labor market, white-collar jobs and salaries are stagnating
Figure 5.Horizontal bar chart showing the percentage point change in the share of white-collar job postings out of total postings, by metro area, between Q1 2023 and Q1 2025. Washington, D.C. saw the largest decline at -0.58 percentage points, followed by Chicago (-0.41), Dallas (-0.40), Boston (-0.33), Philadelphia (-0.31), Atlanta (-0.28), Los Angeles (-0.27), Houston (-0.25), Phoenix (-0.23), and Minneapolis (-0.19). Source: Revelio Labs, May 2025
title="Horizontal bar chart showing the percentage point change in the share of white-collar job postings out of total postings, by metro area, between Q1 2023 and Q1 2025. Washington, D.C. saw the largest decline at -0.58 percentage points, followed by Chicago (-0.41), Dallas (-0.40), Boston (-0.33), Philadelphia (-0.31), Atlanta (-0.28), Los Angeles (-0.27), Houston (-0.25), Phoenix (-0.23), and Minneapolis (-0.19)."